

The Tapestry
What WWE’s narrative-debt chart looks like in May 2026 — and what it tells the writers’ room before a word is spoken

What WWE’s narrative-debt chart looks like in May 2026 — and what it tells the writers’ room before a word is spoken
A showrunner carries the whole picture in their head.
Open threads. Payoff windows. Which side of the roster has momentum, which side is fragmenting into disconnected strands. Who’s owed a credential. Where debt is accumulating — and when the audience is going to start noticing that a promise was made four weeks ago and nothing has come of it.
The good ones carry it without writing it down. They walk into a production meeting and know, instinctively, that the Fatu thread is overheating, that the babyface side has no connective tissue, that a thread hasn’t advanced in three shows and the crowd is starting to feel it. They know because they’ve been watching — every segment, every week, every subtle shift in who stood tall and who ate the pin.
The question is whether the picture in their head can be rendered. Made legible. Handed to someone who wasn’t in the room for every episode and asked: read this in eight seconds and tell me what the show owes the audience.
I built a tool that does this. It’s called Skein — named for a length of thread wound loosely, the way storylines coil through a wrestling calendar before they’re pulled taut. It’s running right now on ten shows of WWE data — the SmackDown go-home, WrestleMania 42, the Raw After Mania, five weeks of weekly television, and Backlash 2026.
This is what the tapestry looks like.
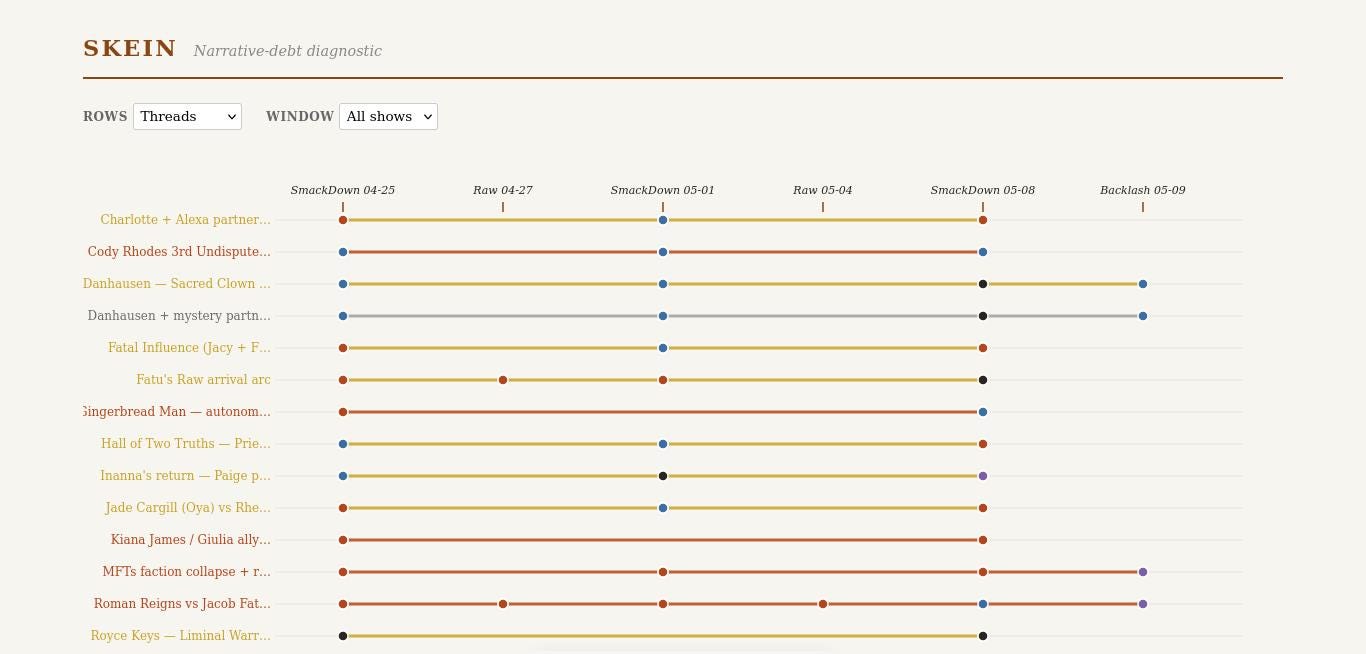
What You’re Looking At
One hundred twenty-one segments. Seventy-two narrative threads. Ninety-three characters. Ten shows spanning four weeks — go-home SmackDown through Backlash — structured into JSON, every segment tagged with its carriers, its threads, its outcome, and who stood tall at the end.
The horizontal lines are threads — storylines tracked across time. Color encodes temperature: terracotta is hot (advanced in the last show at main-event or A-block prominence), gold is warm (advanced within three shows), ash is dormant (four or more shows since the last advance). Dots mark where characters intersect with threads. Blue dots are babyface stand-talls. Red dots are heel stand-talls.
Flip the dropdown to “Characters” and the Y-axis reorganizes. Now the rows are performers, and you can see at a glance who is carrying the show and who is invisible.
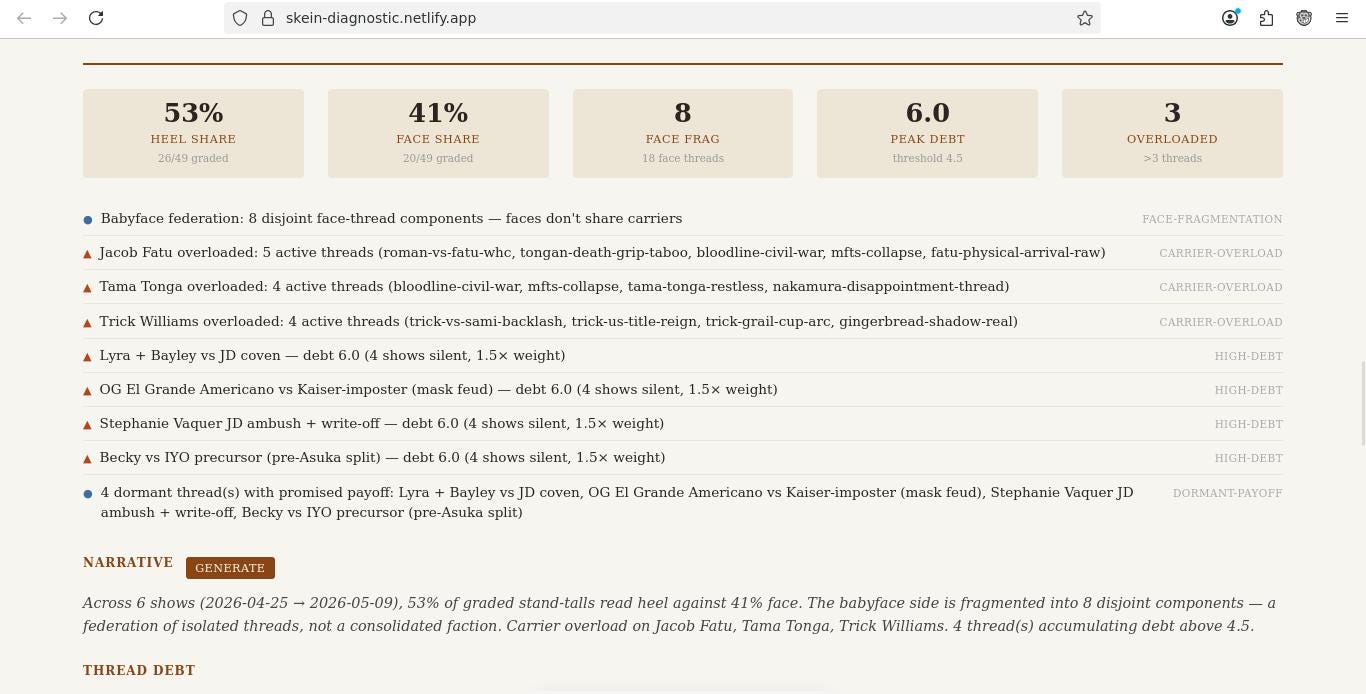
Below the tapestry, the diagnostic ledger runs the numbers.
The Diagnostic
Ten shows. Here is what the numbers say about WWE’s narrative state from the WrestleMania 42 go-home through Backlash 2026:
Forty-one face. Forty heel. Of eighty-four segments where someone stood tall — where the closing image held on one side with the advantage — forty-one were babyface-coded. Forty were heel. Three were split. Nearly even. But zoom the time window to just the five-week Backlash build and the split tilts hard heel. The go-home show and WrestleMania itself ran face-dominant — corrections, coronations, clean finishes honoring the performers the crowd came to see. The weekly television that followed tilted the ledger back toward heel advantage. The diagnostic surfaces this because it lets you adjust the window and watch the read change. A showrunner who only looks at the last four weeks sees a different show than one who looks at the full arc from Mania forward.
Nine disjoint face-thread components. This is the fragmentation index, and it’s the single most diagnostic number on the page. It means the babyface side of the roster is operating as nine separate, unconnected strands. Cody’s title defense doesn’t share a carrier with Trick’s US title reign. Rollins’s feud with Breakker runs on a completely separate strand from Danhausen’s sacred-clown arc. None of them intersect through shared antagonists or bridging characters. The heel side — Bloodline, Vision, the institutional apparatus — has connective tissue. The babyface side has a federation of individuals.
Jacob Fatu carries six active threads. Six. The next-highest carriers — Liv Morgan at five, then Roman Reigns, Tama Tonga, and Trick Williams at four each. Fatu is the most structurally overloaded performer on the roster, and the tapestry makes this visible in a way that a written summary can’t: his name appears in the carrier list of six concurrent storylines, each demanding screen time, each advancing on its own schedule, each one a promise to the audience that requires servicing.
The overload isn’t a problem yet. It’s a diagnostic flag. It tells the writers’ room: if Fatu gets injured, six threads go dormant simultaneously. That’s not a performer issue. It’s a structural vulnerability in the booking architecture.
Eleven threads in heavy debt. These are storylines planted — some seeded at the Raw After WrestleMania, some on the go-home — that haven’t been serviced since. Punk vs. Cody. Rusev’s IC title chase. Rhea’s road to Liv. Each one is a promise the show made to the audience. Some are long builds by design; others are threads the television moved past. The diagnostic doesn’t judge intent — it surfaces the debt. What the analyst does with that picture is the work.
The Methodology
Skein’s compute layer is pure JavaScript. Five modules — temperature, debt, stand-tall alignment, fragmentation, carrier load — each deterministic, each tested, each running the same formula every time. No AI at diagnostic time. The numbers are what the data says, not what a model guesses.
AI enters at two edges: ingest and narration. When I need to turn a markdown show log into structured segment data, a Claude model reads the log and returns JSON matching the schema. I review every field. I edit. I correct. Then the data enters the corpus. At the other edge, an optional narration endpoint feeds the computed diagnostic to a smaller model and asks for a one-paragraph analytical summary — a convenience, not a dependency. The diagnostic works without it.
The design choice is deliberate. The tool that audits narrative structure should not itself depend on narrative generation to function. If the AI goes away, the tapestry still renders. The debt still computes. The fragmentation index still returns nine. The diagnostic is the math. The narration is the gloss.
The data substrate is my own show logs from The Worked Shoot — hand-curated, segment-level coverage of every SmackDown, Raw, and PLE I’ve watched and logged since mid-April 2026. Every segment in the Skein corpus has provenance: I watched the show, I wrote the log, I structured the data. The diagnostic recovers patterns I had already identified by watching — that’s the validation. If the tool’s computed read diverges from the analyst’s live read, one of them is wrong, and the process of finding the discrepancy tightens both.
What the Tapestry Tells You That a Summary Can’t
A written report says: “The babyface side is fragmented.” The tapestry shows it — nine separate strands of blue dots with white space between them. No shared carriers. No intersecting threads. The topology is visible. You don’t have to take the analyst’s word for it.
A written report says: “Fatu is overloaded.” The tapestry shows his name recurring in the carrier list of six concurrent horizontal lines, each one demanding its own advancement cadence. The density is visible. A booker glances at the chart and knows, without reading a paragraph, that this performer is a structural bottleneck.
A written report says: “Backlash closed two threads.” The tapestry shows two lines terminating with tick marks at the rightmost column — Asuka vs. IYO, Danhausen vs. Miz & Wilson — and one line shifting from solid to dashed purple where Kabuki Warriors transformed from a paired-faction thread into solo arcs. Closure and transformation are geometric events on the chart, not sentences in a memo.
This is the argument for visualization over narrative: the tapestry compresses a ten-show, one-hundred-twenty-one-segment, seventy-two-thread picture into a single image that a showrunner scans in the time it takes to drink their coffee. The ledger below it provides the numbers. The print stylesheet fits the whole diagnostic onto one page for a production meeting.
The diagnostic is the writing sample.
Why I Built This
The first article in this series laid out the pharmacy thesis — what professional wrestling is, structurally, and why a framework for reading the build can predict outcomes at a rate that can’t be attributed to chance. Sixteen for eighteen across two PLEs.
Skein is the next step. The predictions demonstrate that the structural read works. The diagnostic demonstrates how it works — by rendering the narrative topology that the predictions are read from. The tapestry is the territory the pharmacist surveys before writing the prescription.
The tool exists because I needed the picture on the wall. Not a spreadsheet of match results. Not a calendar of who’s booked where. A diagnostic — a living chart that shows, at a glance, where the narrative-debt picture stands. Which threads are overheating. Which performers are overloaded. Where the babyface side has fragmented into disconnected strands. Where the audience has been promised a payoff that hasn’t arrived.
This is the work I want to do. Building the tools that make the invisible structure of serialized storytelling visible — and being in the room where they’re used.
The tapestry is live.
Skein is running at skein-diagnostic.netlify.app and the source is on GitHub. The Worked Shoot publishes pre-PLE picks and structural reads on X @jvanhorn_. The scrolls — deep-dive essays on the archetypes behind the performers — live at Ritual Mirror. This Substack is where the methodology and the tools meet: structural diagnostics for the art form that runs on structure.